Linear Programming problem Diet Mix: Computer
Exercise
3
(problem B-42 from the heizer Render web site)
http://cwx.prenhall.com/bookbind/pubbooks/heizer2/chapter24/deluxe.html
goto additional problems, Module B, B.42
Set this up in EXCEL and solve using Solver
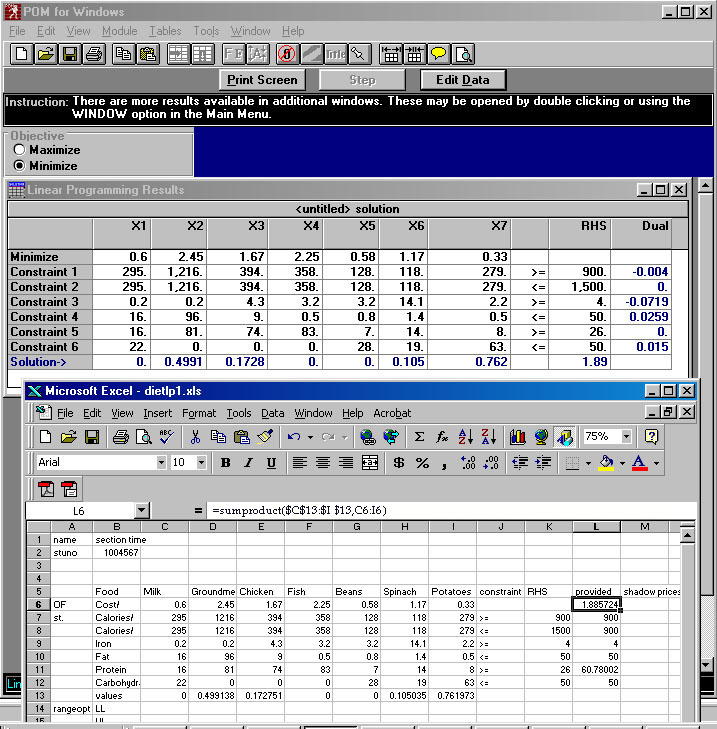
set up the same problem in POM-QM and compare the
results.
This comparison should help you interpret the sensitivity and range
analyses
from the solver output. Everyone will have slightly different
numbers
as you will use the last 4 digits of your student number to replace the
cents in the prices for ground meat and chicken.
Rachel Yang, campus dietitian for a small Illinois
college,
is responsible for formulating a nutritious meal plan for students. For
an evening meal, she feels that the following five meal-content
requirements
should be met: (1) between 900 and 1,500 calories (you will need two
rows
for calories, one to set the upper limit, one to set the lower limit);
(2) at least 4 milligrams of iron; (3) no more than 50 grams of fat;
(4)
at least 26 grams of protein; and (5) no more than 50 grams of
carbohydrates.
On a particular day, Rachel’s food stock includes seven
items that can be prepared and served for supper to meet these
requirements.
The cost per pound for each food item and its contribution to each of
the
five nutritional requirements are given in the accompanying table:
Procedure: I've done most of this for you.
Data can be put into EXCEL in one of three ways:
-
Use the text tool in Acrobat to copy it from the
Heizer-Render
website. Paste into EXCEL. use data/text-to columns (space delimiter)
to
parse it, make necessary adjustments. See the Video
-
Copy the data from the bottom of this page and
paste into
EXCEL. use data/text-to-columns (space delimiter) to parse it, make
necessary
adjustments.
-
Type the data in, being careful to avoid
transcription errors.
Use copy, paste special /transpose (video on paste
special
transpose) to put the data in a more familiar configuration (columns
for
decision variables, rows for objective function and constraints).
Duplicate
the calories row to allow two (upper and lower) constraints on
calories.
Move the cost coefficients row (objective function) to the top data
row.
Add a row for Values (which Solver will manipulate), and rows for Upper
and Lower Limits on the ranges of optimality. Add columns for direction
of constraint, RHS, amount provided, and Shadow Price for each
ingredient.

The formula for each 'amount provided' will consist
of
the sum of each of the (variable values * amount provided per
pound)
The easiest way to do this is through the Sumproduct Function. In cell
L6, enter =sumproduct($C13:$I13,C6:I6) you can do this by
entering
"=sumproduct(" then select the ranges, use F4 to absolute references to
the value row and put in the close parenthesis before pushing enter.
You
will only have to enter the calculation once, then you can just copy it
down to subsequent rows.
In the event solver tells you there is "no feasible
solution
found" check your formulas and make sure you have the right
directionality
on the constraints. (The selections for sensitivity reports will be
grayed
out if there is no feasible solution.) Note that the amount provided
column
for the cost row will give the cost.
Use Solver to solve this problem and give sensitivity
analysis. See the videos on the X-Y problem to see how to add in and
use
Solver and how to interpret the sensitivity analysis.
Tips for using POMQM
Use POM-QM's LP module to solve this same problem and
print
out the results to help you interpret the EXCEL output.
It is possible to copy and paste data one part at a
time
using the POM-QM menu item, (edit/paste-from-clipboard doesn't work for
the constraint directions from EXCEL to POM-QM). It's a little
tricky.
You could also simply type in the data using your EXCEL sheet layout as
a guide. POM-QM should give the same solutions as SOLVER. Be aware the
sensitivity numbers are expressed differently, but the solutions
(values
and objective value) should be the same.
If EXCEL and POM-QM don't agree on the basic values,
see the list of things that can go wrong, below.
Enter values for the Upper and Lower Limits on the
Range
of Optimality and the Shadow Prices on this sheet and put it first to
facilitate
grading. It's easiest to understand these on the POM-QM sensitivity
analysis
(Ranging) but you should compare these to the SOLVER sensitivity
analysis
just to understand how they are expressed differently.
Printouts due: (one legible, complete page
preferable. Example of what needs to be
in it.)
1) the EXCEL problem formulation sheet, Adding in
results
to summarize shadow prices and ranges of optimality. Printouts of the
range
and sensitivity analyses to support the summary numbers put in
the
initial sheet.
2) the same for the POM-QM solution and ranges. No need
to add summaries as you will show these on the EXCEL sheet. The results
should be the same as the EXCEL Solver solution. Please don't print out
iterations.
3) answer these questions:
What combination and amounts of food items will provide
the nutrition Rachel requires at the least total food cost?
a) How much could the price of milk increase without
changing the solution?
b) How low would the price of ground meat have to be
before you would use more?
c) How much would the cost increase if you needed one
more gram of iron?
d) how high could the price of beans go before you
would
change the diet?
Table of Food Values* and Costs
Food Calories/ Iron Fat Protein Carbohydrates Cost/
Item Pound (Mg/Lb) (Gm/Lb) (Gm/Lb) (Gm/Lb) Pound ($)
Milk 295 0.2 16 16 22 0.60
Ground meat 1216 0.2 96 81 0 2.45
Chicken 394 4.3 9 74 0 1.67
Fish 358 3.2 0.5 83 0 2.25
Beans 128 3.2 0.8 7 28 0.58
Spinach 118 14.1 1.4 14 19 1.17
Potatoes 279 2.2 0.5 8 63 0.33
Source: C. F. Church and H. N. Church, Bowes and
Church’s,
Food Values of Portions Commonly Used, 12th ed. Philadelphia, J. B.
Lippincott, 1975.
Things that can go wrong:
If POM-QM and EXCEL solutions are different:
Compare to the screen captures above, this will tell
you
whether things are set up right and will identify which one is off.
Proofread the directionalities of the constraints and
make sure you MINIMIZE cost!.